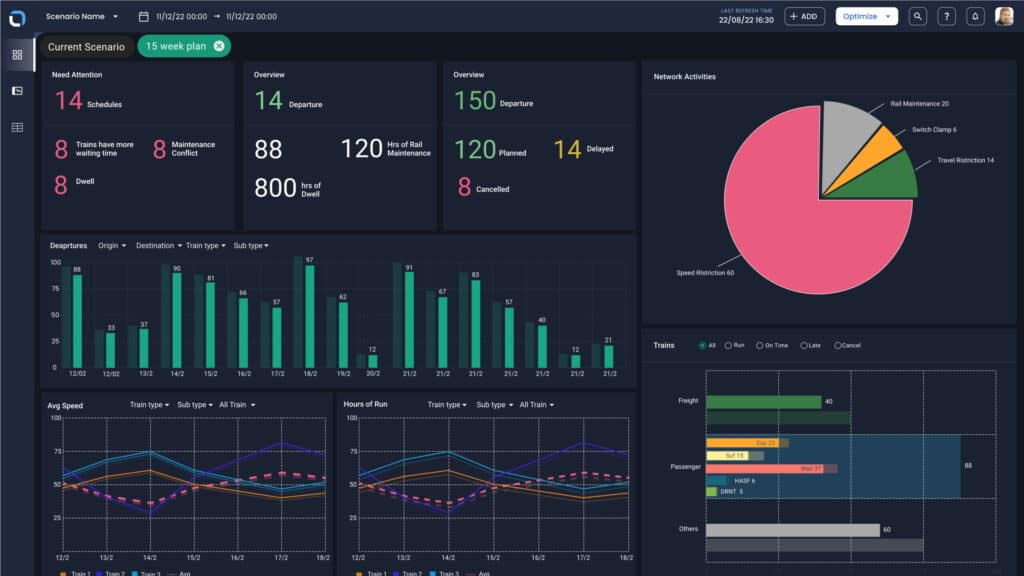
Industry's most intuitive train graph View train routes and ETAs. Identify and resolve conflicts. Plan maintenance activities to avoid disruption. See speed restrictions and tracks out of service. Collaborate and talk to other users in real time. Actionable KPIs to improve operationsUse RailMax’s dashboards to see how your operations are running one intuitive place. Everything important in one place See key metrics such as velocity, schedule adherence, and train delay. Identify Hotspots See KPIs for the entire network, specific areas, select train groups, or individual trains. Find what matters Filter KPIs by time window to show daily, weekly, or monthly trends. Tailored to your operations Make customizable reports and graphics. Consistent plan execution Accelerate your operations with increased visibility and improved decision making. Stop train delays before they happen and schedule track work with fewer disruptions. Improve on-time performance by increasing velocity, reducing fuel burn, and recovering from unplanned events.